



Spreads to Target
North Carolina Tar Heels @ Pittsburgh Panthers
Pittsburgh -3.5
| Book line | Pittsburgh -3.5 |
| Model number | Pittsburgh -15.5 |
| Gap | 12.0 pts |
| Points check | Pittsburgh -12.9, which is 9.4 past the market |
| SP+ (2026) | Pittsburgh +14.6 (18th) vs North Carolina +1.8 (tied 64th), home edge +2.7 |
| Pittsburgh 2026 | 5-0, 4-1 ATS, 38.4 points a game and 13.4 allowed |
| Pittsburgh defense | 7th Success Rate, 14th Finishing Drives, 93.1 run defense |
| North Carolina | 2-2, 24.0 for and 19.5 against, offense 120th in Explosiveness |
Book has Pittsburgh -3.5. The rating says -15.5 and the points check, built only from each team’s own 2026 point differential plus home field, says -12.9. Two measures sharing no inputs land nine and twelve points past a field goal.
Pittsburgh are 5-0 and the margin is not an accident. They score 38.4 and allow 13.4, the defense ranks 7th in Success Rate and 14th in Finishing Drives on a 90.2 defensive grade and 93.1 against the run, and the offense grades 84.5 passing behind an 82.8 pass block grade.
North Carolina are 2-2 at 24.0 points a game. The offense ranks 49th in Success Rate but 120th in Explosiveness, so it moves the ball without threatening, and that is the profile a defense ranked 131st in Explosiveness allowed is built to live with. Their own defense ranks 106th in Success Rate.
The risk is the price being short for a reason the numbers cannot see. Three and a half points on a 5-0 team against a .500 opponent is the market saying it does not believe the gap, and a 12-point disagreement with two independent measures usually means someone knows something. Pittsburgh’s 59.4 tackling grade is the one soft number to point at.
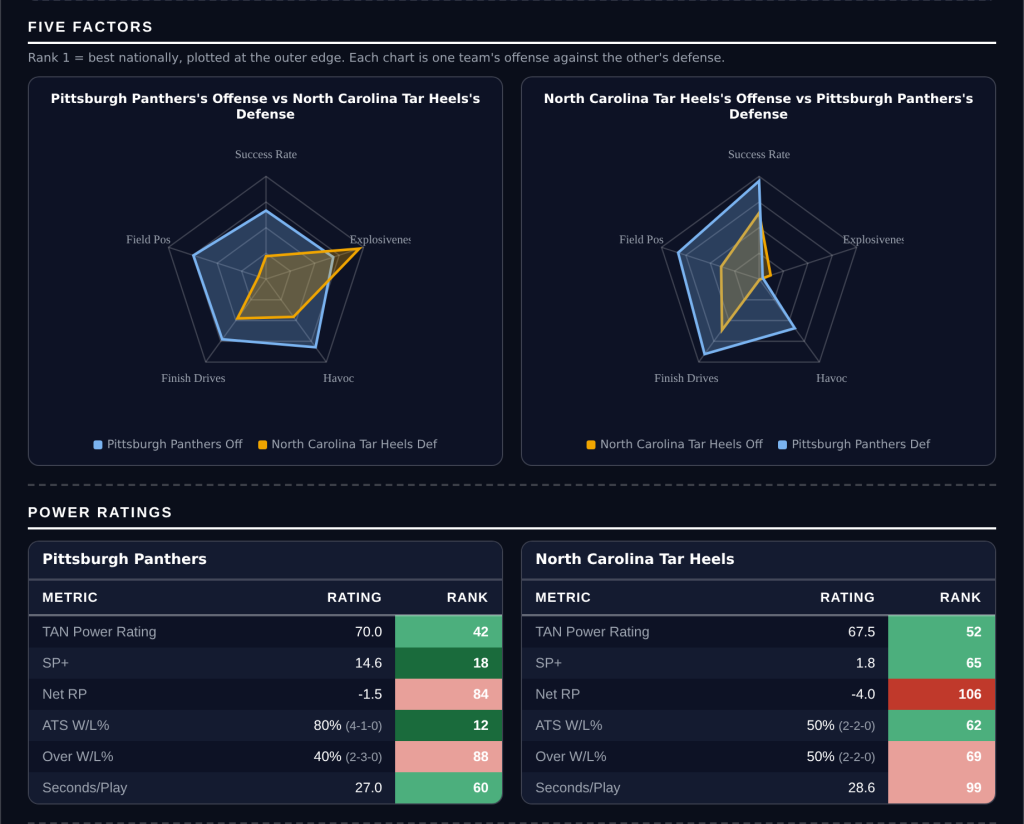
Five Factors and power ratings, captured from the CFB Betting Hub.
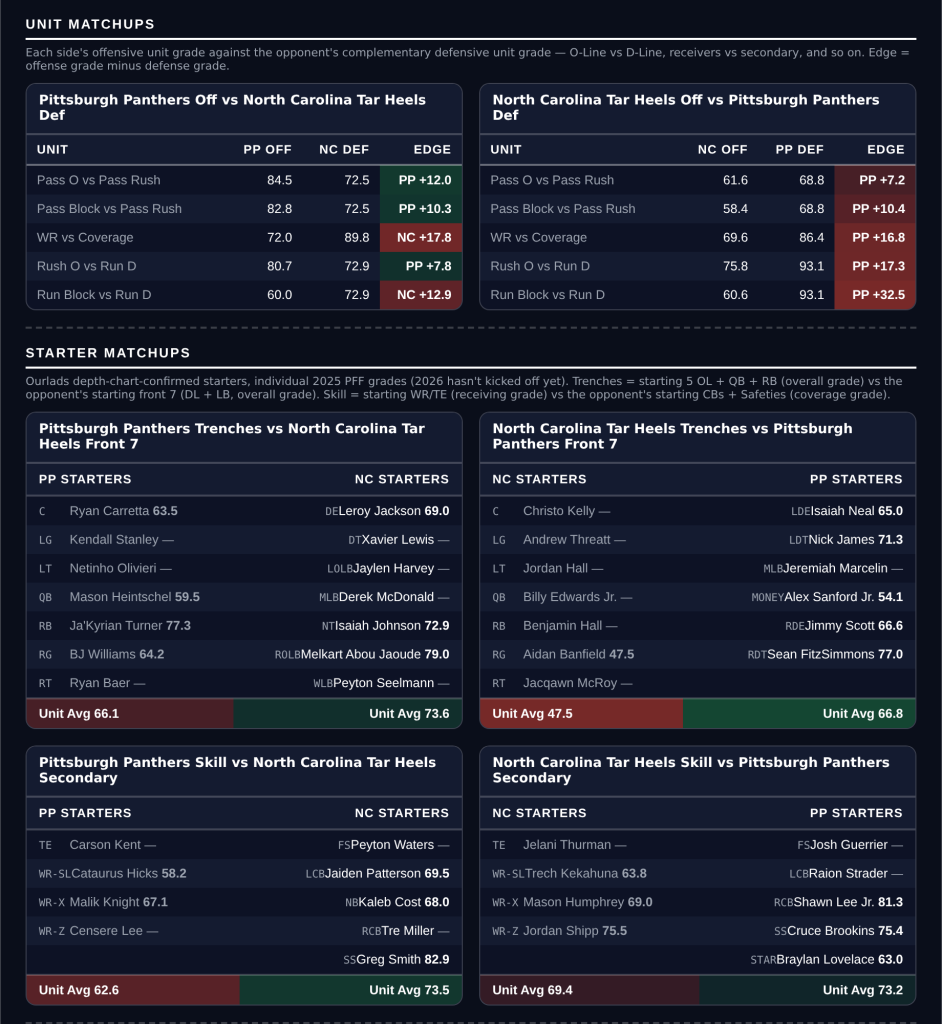
Unit matchups: each offensive unit grade against the opposing defensive unit. Edge = offense minus defense.
Ole Miss Rebels @ Vanderbilt Commodores
Vanderbilt +9.5
| Book line | Ole Miss -9.5 |
| Model number | Vanderbilt +3.5 |
| Gap | 6.0 pts |
| Points check | Vanderbilt -0.2, effectively a pick’em, 9.7 past the market |
| SP+ (2026) | Ole Miss +11.0 (36th) vs Vanderbilt +5.1 (tied 56th), home edge +2.4 |
| Scoring | Ole Miss 35.5 for / 30.8 against, Vanderbilt 25.4 / 25.0 |
| Ole Miss defense | 127th Success Rate, 50.5 coverage, 44.7 tackling |
| Records | Ole Miss 3-1 (1-3 ATS), Vanderbilt 3-2 (3-2 ATS) |
Book has Ole Miss -9.5 on the road. The rating still makes Vanderbilt a 3.5-point underdog, so it is not calling an upset, but the points check has the game at a pick’em. Both reads put the fair number well inside a touchdown.
Ole Miss are the better team and also the leakier one. They score 35.5 but concede 30.8, and the defense ranks 127th in Success Rate and 109th in Finishing Drives on a 50.5 coverage grade and a 44.7 tackling grade. A team that gives up 30 a game laying nine and a half on the road is the whole position.
Vanderbilt are ordinary on offense, 104th in Success Rate and 116th in Finishing Drives behind a 50.9 pass block grade, which is why this is taking points rather than backing a winner. What they do have is a defense ranked 69th with an 82.3 coverage grade against a passing offense that grades 86.2.
The pace argument cuts against. Ole Miss play the 6th-fastest tempo in the country against Vanderbilt’s 110th, so there are more possessions than a home underdog wants. Ole Miss being 1-3 against the spread is the counterweight: the market has already been asking too much of them.
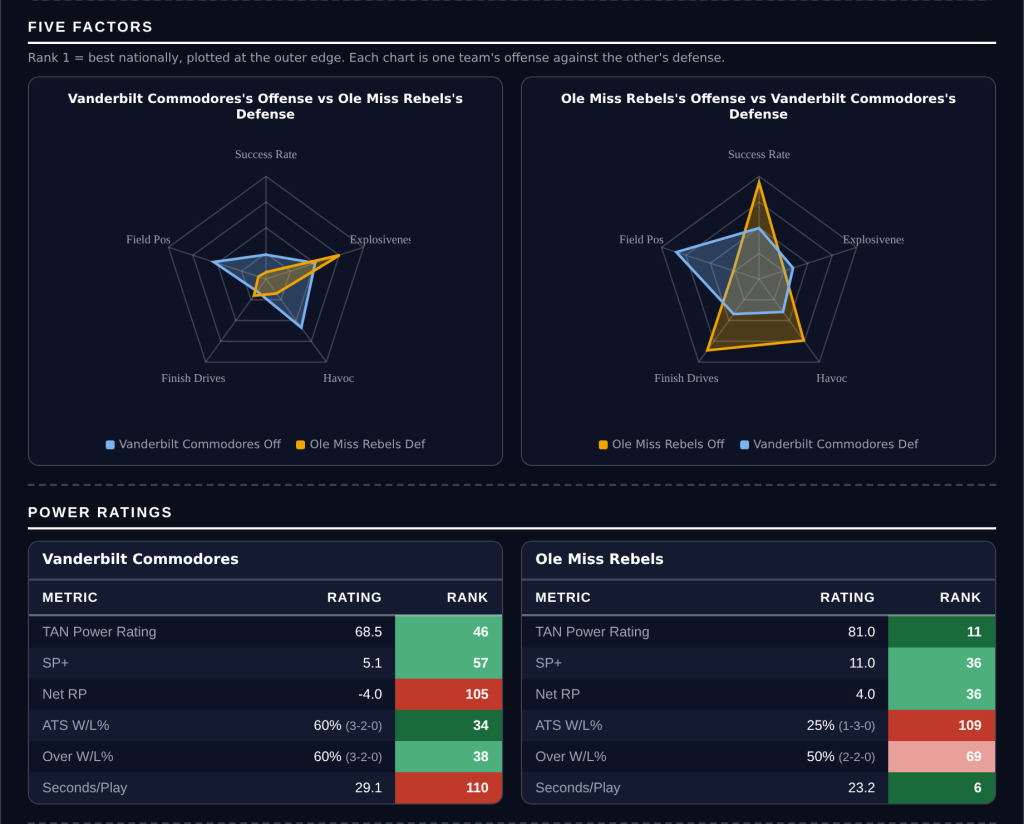
Five Factors and power ratings, captured from the CFB Betting Hub.
Unit matchups: each offensive unit grade against the opposing defensive unit. Edge = offense minus defense.
Air Force Falcons @ Northern Illinois Huskies
Air Force -7.5
| Book line | Air Force -7.5 |
| Model number | Air Force -21.3 |
| Gap | 13.8 pts |
| Points check | Air Force -13.7, which is 6.2 past the market |
| SP+ (2026) | Air Force -0.1 (tied 71st) vs Northern Illinois -23.4 (133rd), home edge +2.0 |
| Northern Illinois | 0-4, 13.8 points a game and 36.3 allowed |
| Northern Illinois offense | 126th Success Rate, 137th Finishing Drives, 47.0 run block |
| Air Force defense | 14th Success Rate, 79.3 coverage |
Book has Air Force -7.5 on the road. The rating says -21.3 and the points check says -13.7. This is the largest model gap on the board and the two reads still agree on direction with six points to spare.
Northern Illinois are 0-4, score 13.8 a game and concede 36.3. The offense ranks 126th in Success Rate and 137th in Finishing Drives behind a 47.0 run block grade, and the defense ranks 110th, 107th and 94th across Success Rate, Explosiveness and Finishing Drives.
Air Force are not good either and the position does not need them to be. They are 3-1 at 29.0 points a game with a defense ranked 14th in Success Rate on a 79.3 coverage grade, against the worst scoring offense on this card.
The honest risk is the shape of an Air Force game. Their offense ranks 129th in Explosiveness, so they grind rather than pull away, and a triple-option team that leads comfortably stops throwing and lets the clock run. Northern Illinois’s 82.0 tackling grade is their one competent unit, and it is the one that keeps a game like this closer than the ratings say.
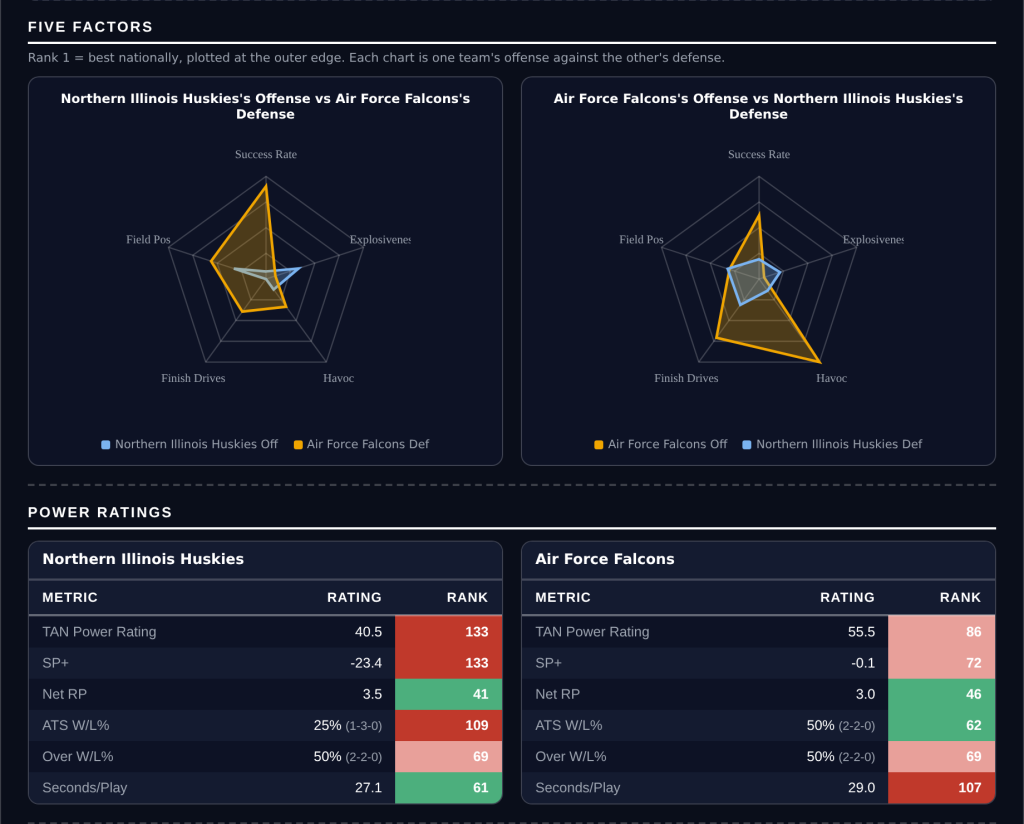
Five Factors and power ratings, captured from the CFB Betting Hub.
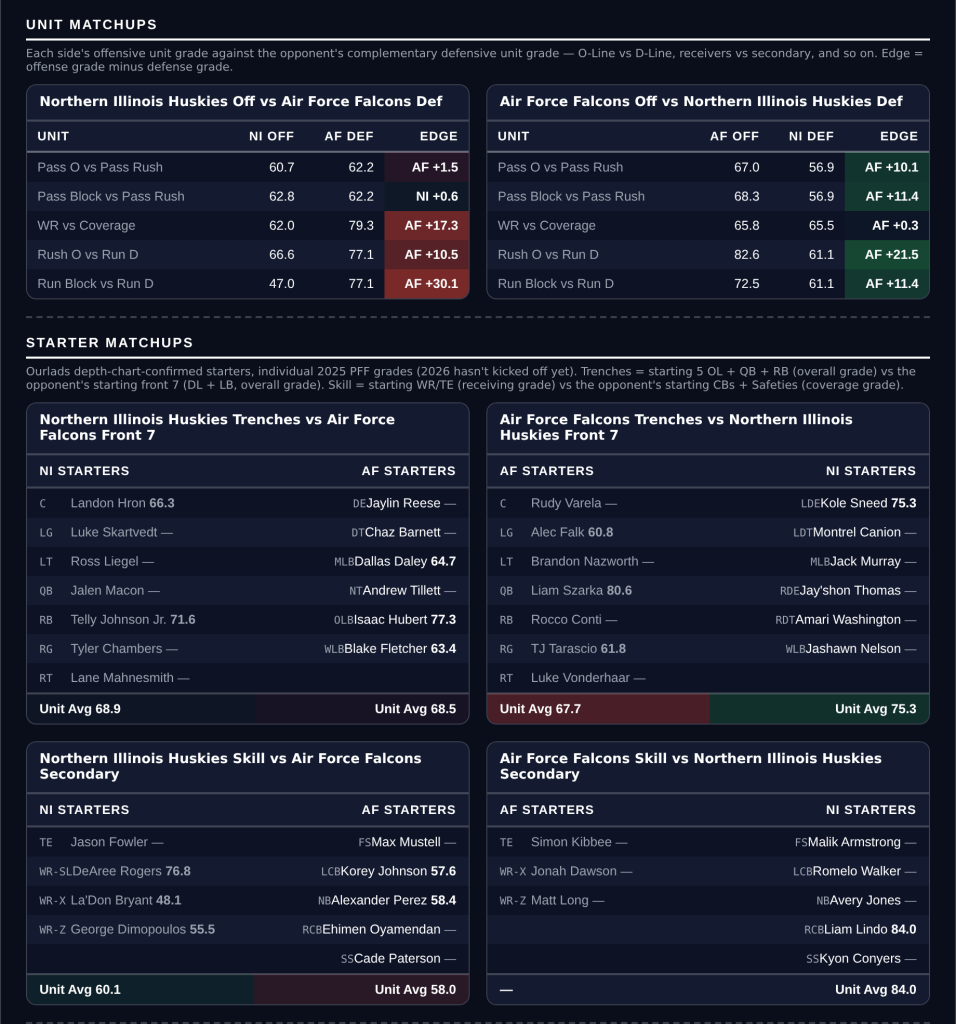
Unit matchups: each offensive unit grade against the opposing defensive unit. Edge = offense minus defense.
Tulane Green Wave @ Army Black Knights
Army -3.0
| Book line | Army -3.0 |
| Model number | Army -8.4 |
| Gap | 5.4 pts |
| Points check | Army -12.1, which is 9.1 past the market |
| SP+ (2026) | Army -1.4 (79th) vs Tulane -6.7 (97th), home edge +3.0 |
| Scoring | Army 33.3 for / 19.8 against, Tulane 18.8 / 23.3 |
| Army offense | 4th Success Rate, 92.9 offensive grade, 87.7 run block |
| Tulane offense | 135th Success Rate, 132nd Finishing Drives, 54.6 pass block |
Book has Army -3.0 at home. The rating says -8.4 and the points check, which knows only what each side has scored and allowed, says -12.1. The second measure is the more emphatic of the two here, which is unusual.
Army’s offense is the case. It ranks 4th nationally in Success Rate on a 92.9 offensive grade, 89.9 passing and 87.7 run blocking, and they score 33.3 a game. Against a Tulane defense ranked 66th with a 56.6 coverage grade and a 51.8 tackling grade, that is a unit mismatch the three points does not price.
Tulane cannot move the ball. They rank 135th in Success Rate and 132nd in Finishing Drives behind a 54.6 pass block grade and score 18.8 a game. Their one distinction is ranking 1st in Explosiveness, which is the warning attached to this: a team that cannot sustain anything but can hit a long one is exactly the profile that steals a backdoor cover.
Army’s defense is the reason this is only three: 117th in Success Rate and 121st in Havoc on a 61.5 coverage grade. Tulane at 1-3 against the spread is running behind its rating rather than ahead of it, which is the shape this card wants to be on the right side of.
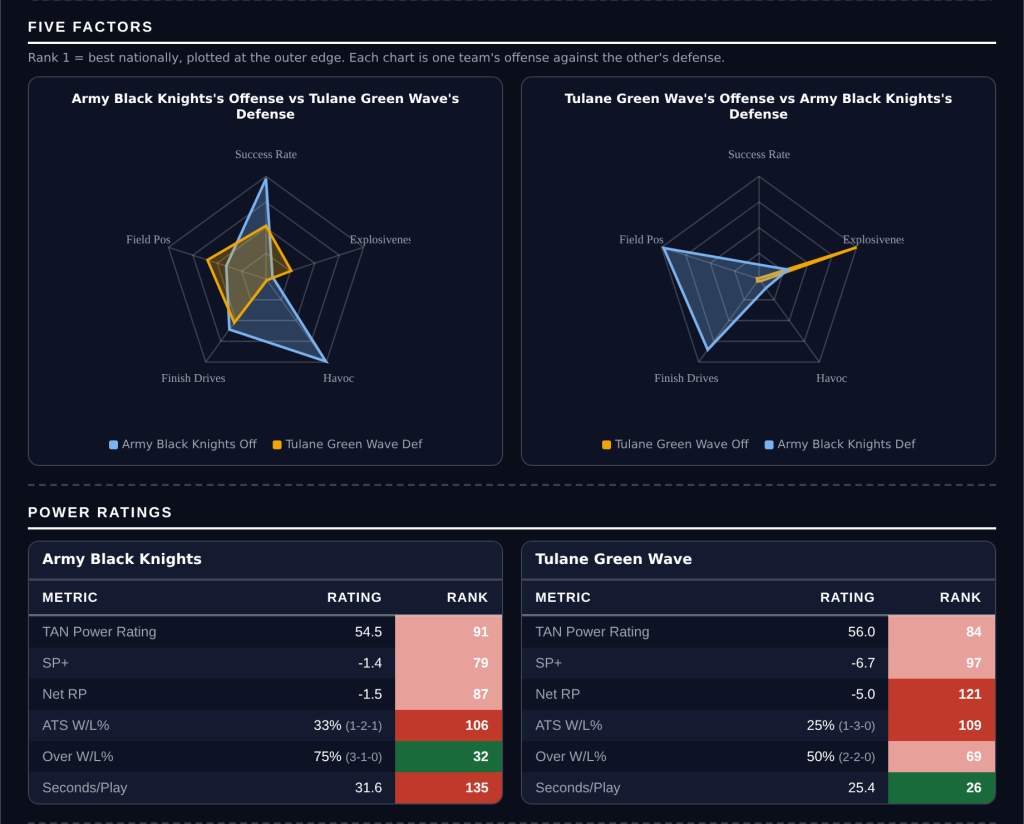
Five Factors and power ratings, captured from the CFB Betting Hub.
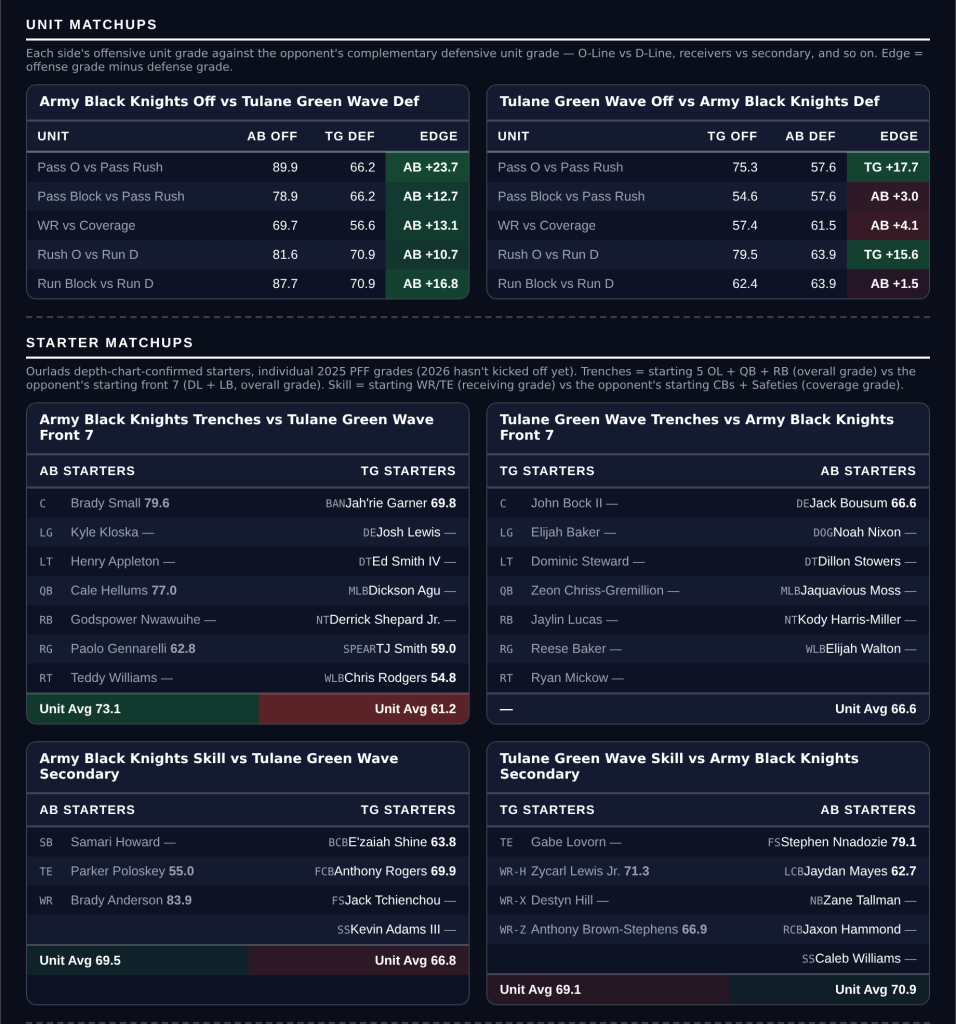
Unit matchups: each offensive unit grade against the opposing defensive unit. Edge = offense minus defense.
UCF Knights @ Oklahoma State Cowboys
UCF +10.5
| Book line | Oklahoma State -10.5 |
| Model number | Oklahoma State -4.8 |
| Gap | 5.7 pts |
| Points check | Oklahoma State -4.0, which is 6.5 past the market |
| SP+ (2026) | Oklahoma State +10.5 (42nd) vs UCF +8.4 (49th), home edge +2.7 |
| Scoring | UCF 32.4 for / 17.6 against, Oklahoma State 37.3 / 19.8 |
| UCF defense | 51st Success Rate, 13th Finishing Drives, 89.0 run defense, 81.7 tackling |
| Records | UCF 3-2 (4-1 ATS), Oklahoma State 3-1 (3-1 ATS) |
Book has Oklahoma State -10.5. The rating says -4.8 and the points check says -4.0. Two measures put the fair number at under a touchdown and the market is asking for a touchdown and a half more.
The two teams are closer than the price suggests. SP+ separates them by two points, 42nd against 49th. UCF concede 17.6 a game behind a defense ranked 51st in Success Rate and 13th in Finishing Drives, on an 89.0 run defense grade and 81.7 tackling, which is the best defensive unit in the game.
Oklahoma State are the better offense, 26th in Success Rate on an 82.3 grade, and that is the honest case for laying the points. What undercuts it is 124th in Explosiveness: they move the ball steadily and do not break games open, which is the profile that struggles to cover double digits.
UCF’s own offense is the problem, 102nd in Success Rate on a 55.1 passing grade, and a team that cannot score can lose by three touchdowns as easily as by seven points. Taking the points rather than the side is how the position survives that. UCF are 4-1 against the spread, so the market has been underrating them rather than the reverse.
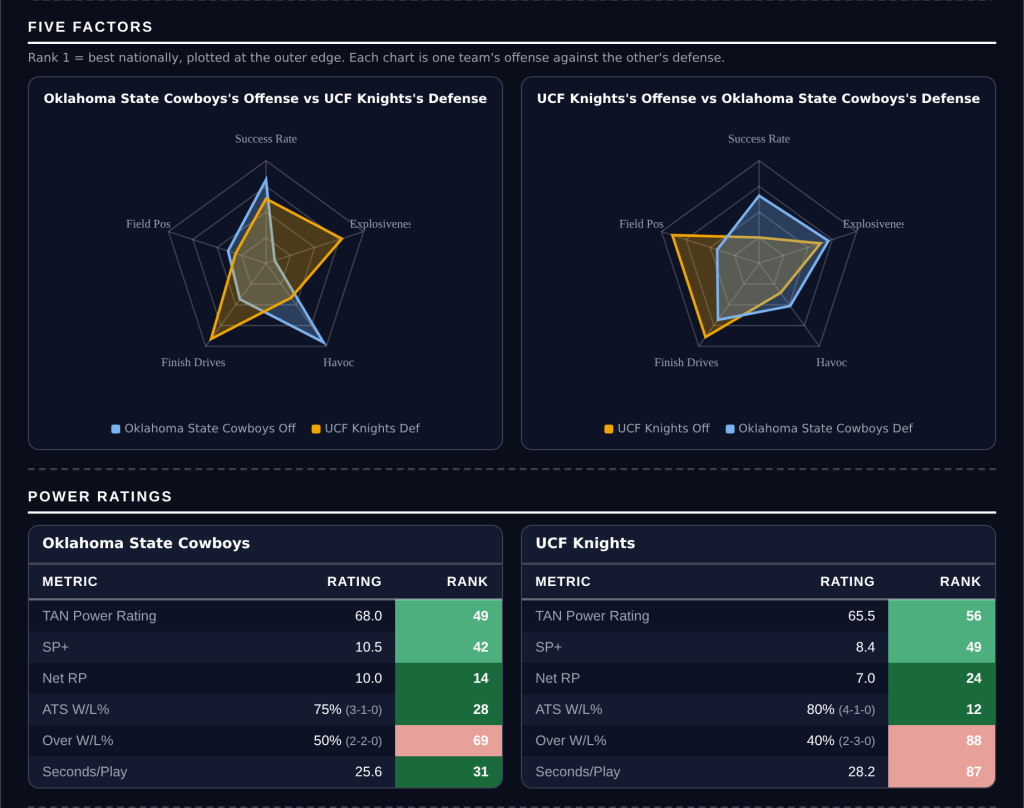
Five Factors and power ratings, captured from the CFB Betting Hub.
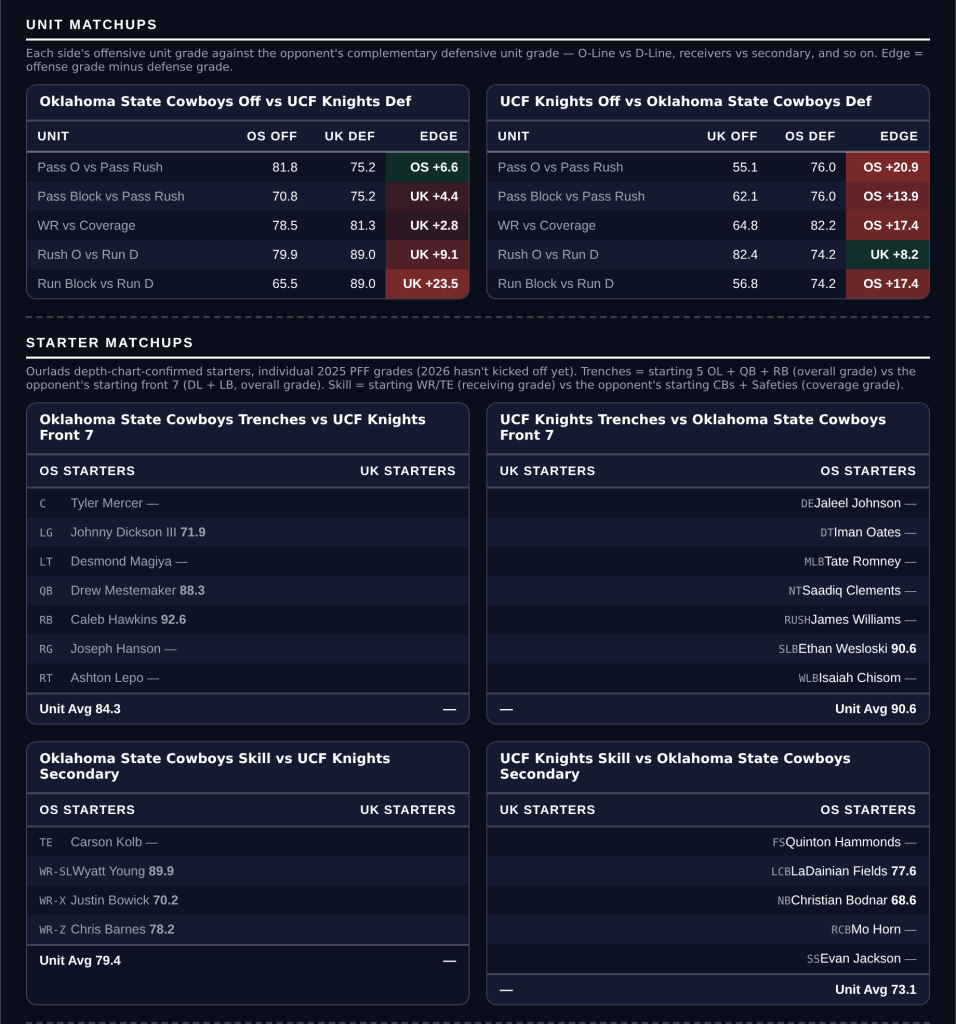
Unit matchups: each offensive unit grade against the opposing defensive unit. Edge = offense minus defense.
